Introduction
Maven Toys is a prominent toy store located in Mexico. As of the end of Q3 2018, the store has encountered a decline in revenue compared to the previous quarter. To address this challenge, Maven Toys is striving to increase its revenue by the end of Q4. An in-depth analysis of sales data from January 1, 2017, to September 30, 2018, is underway, focusing on identifying potential revenue growth opportunities for Q4 2018.
Data Overview
This dataset is sourced from Kaggle and comprises over 829,262 transactions across all stores operated by Maven Toys, providing a robust foundation for analysis.
Methodology
Data Cleaning and Preprocessing
Handling missing values, correcting data types, and preparing data for analysis.
Exploratory Data Analysis (EDA)
Understanding key patterns, trends, and outliers.
Data Visualization
Using Tableau for creating interactive visualizations to represent key findings.
Statistical Analysis
Calculating correlations, performing hypothesis testing, and identifying trends.
Tableau Dashboard
You can explore the interactive visualizations and insights in Tableau at the following link:
Tableau Dashboard: Maven Toys Revenue Analysis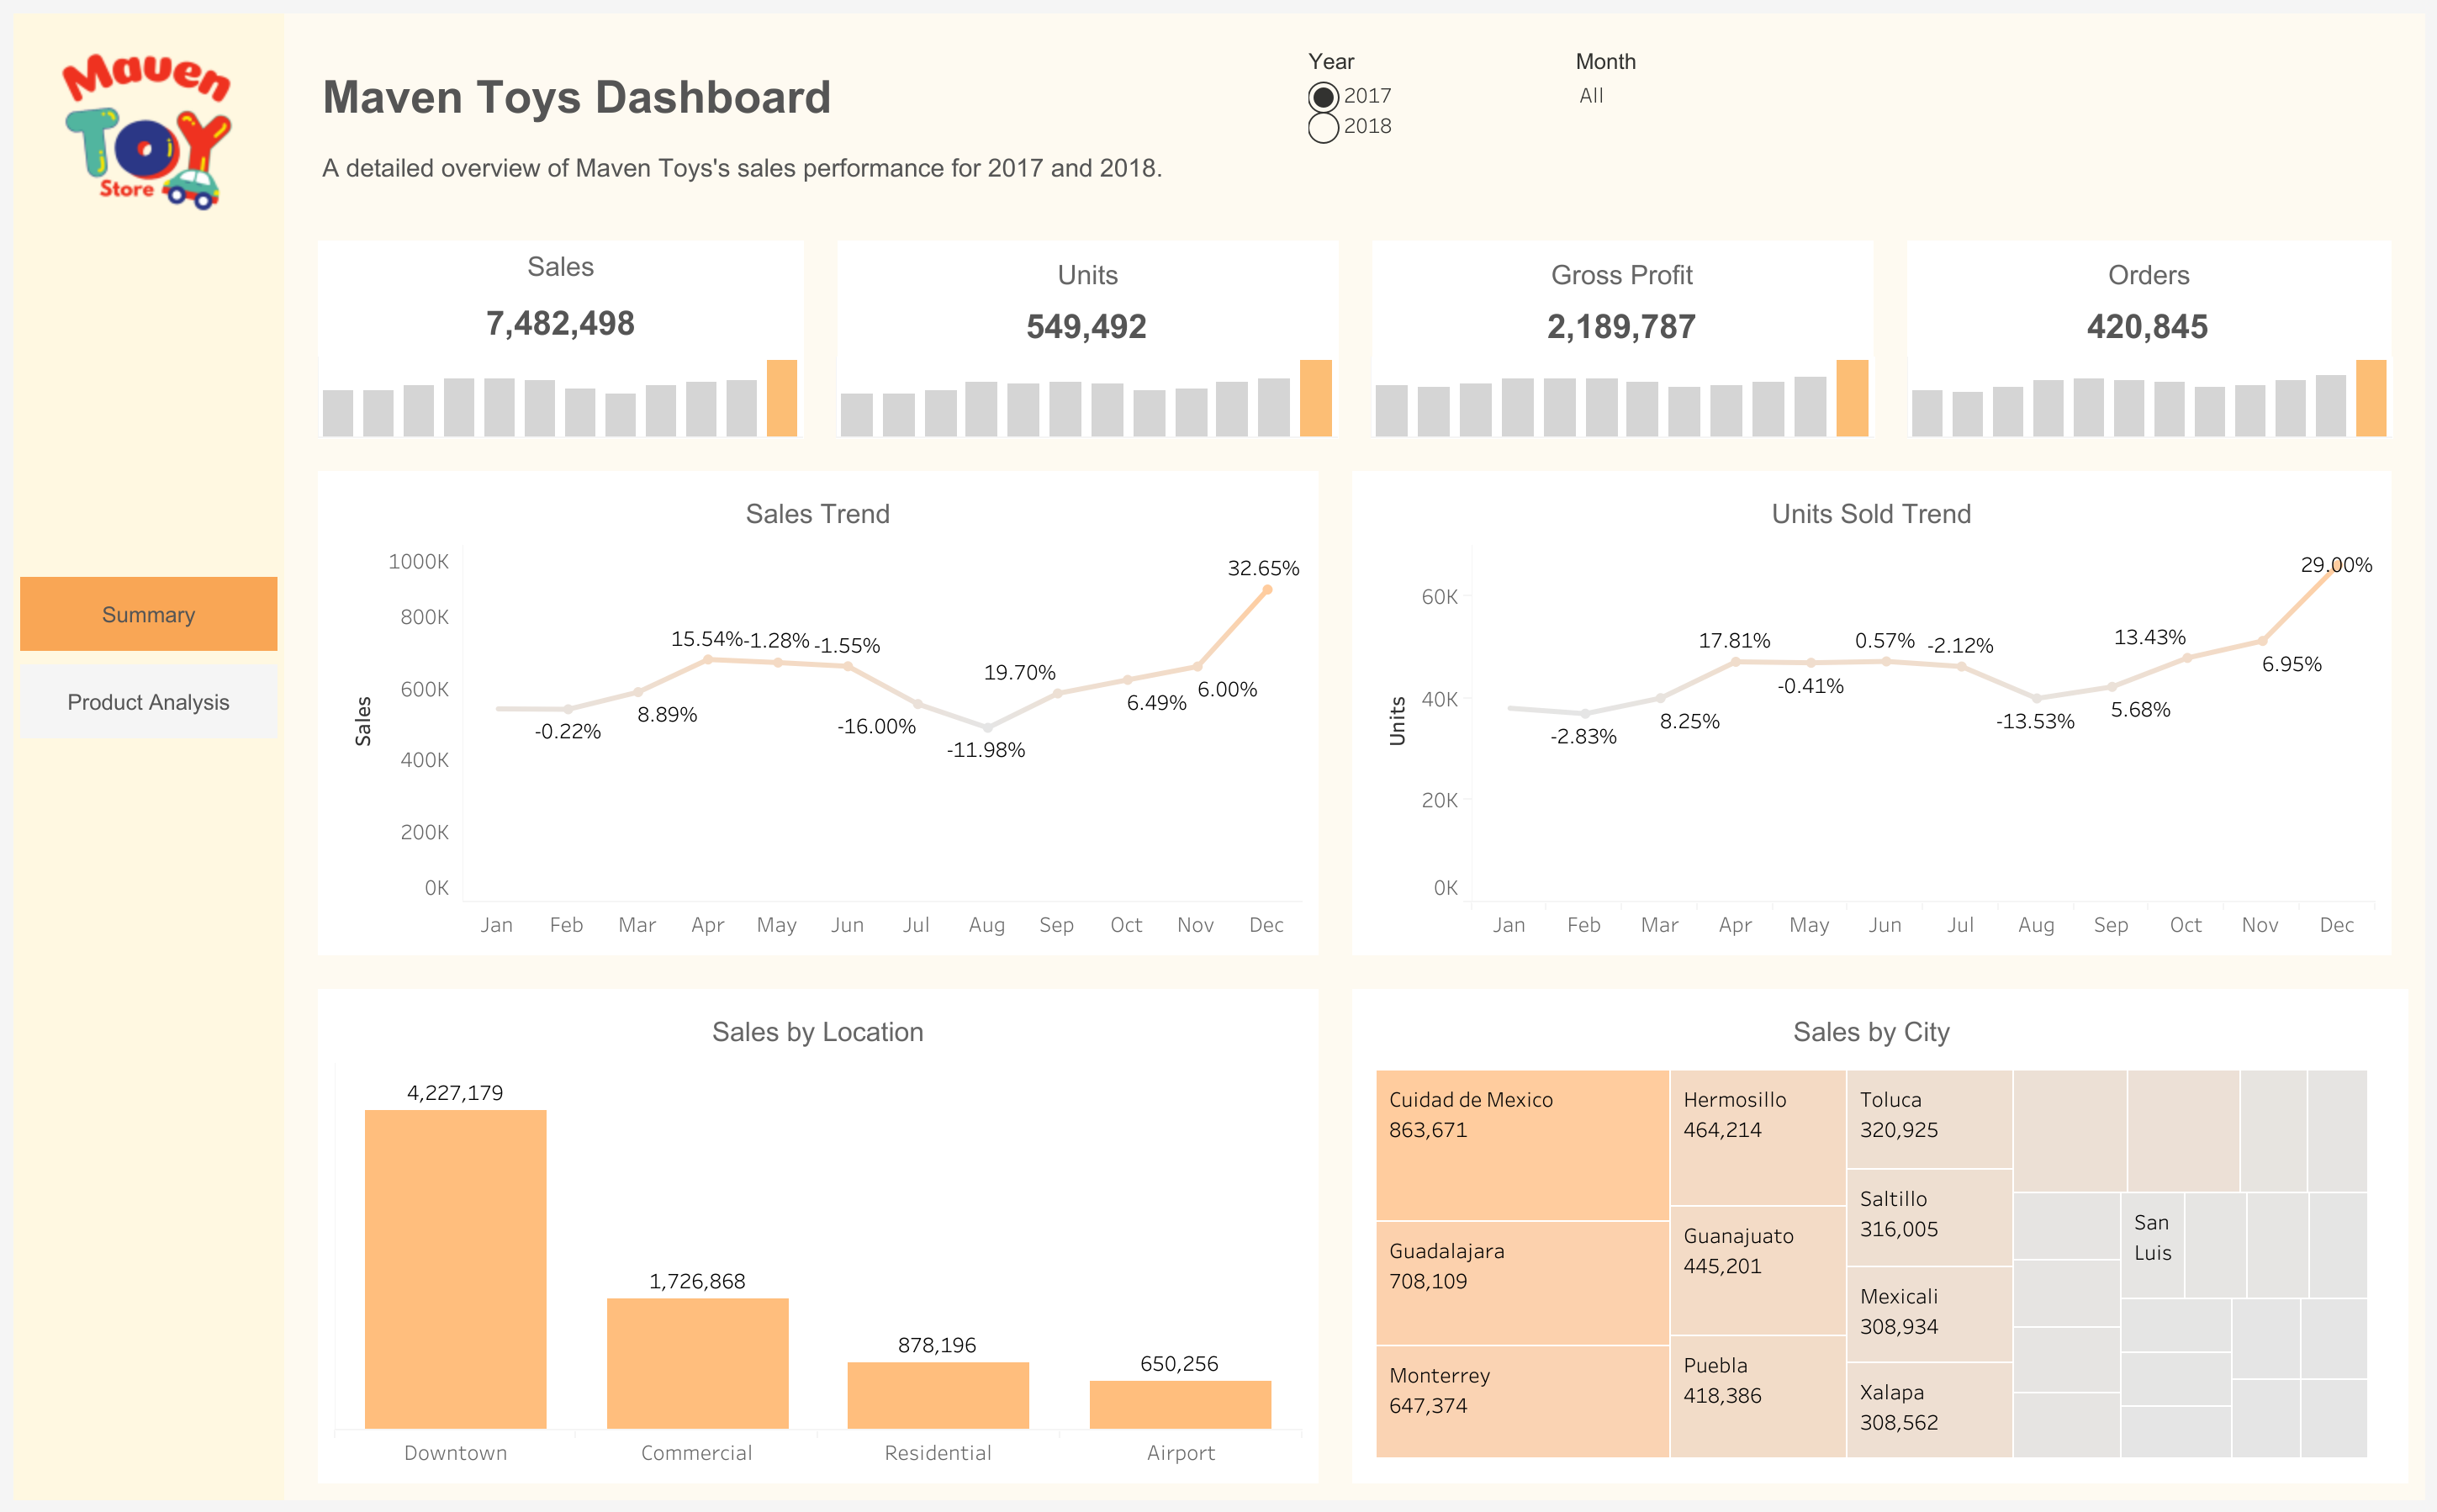

Conclusion
Toy sales experienced a significant spike in Q4. The 35% revenue increase target in Q4 2018 is achievable if Maven Toys optimizes efficient sales strategies, including inventory management and appropriate promotions.
Recommendations
Create Bundles
Combine best-selling products with slower-moving items in bundles to increase the appeal of less popular products.
Bundle Packages
Offer attractive product bundles to encourage customers to purchase more items at once, increasing overall sales volume.
Segmented Discounts
Apply discounts on top-selling products during high-sales periods, December 24th and 31st, in high-performing locations. For lower-performing locations, offer smaller discounts to attract sales.
Targeted Marketing
Launch marketing campaigns based on consumer buying patterns, especially for bulk-purchase-prone product categories, to maximize customer engagement and boost sales during peak seasons.
Optimize Inventory
Monitor stock levels in real-time. Increase stock for high-demand products and ensure quick restocking to prevent product shortages.
Loyalty Programs
Offer loyalty rewards for customers purchasing in bulk or purchasing from high-demand categories, encouraging repeat business and larger purchases.
Seasonal Promotions
Plan for seasonal promotions that capitalize on high-purchase periods, aligning discounts and offers with customer shopping behaviors during peak months.
Libraries and Tools





GitHub Repository
Access the complete code and documentation for the Revenue Increase Analysis project on GitHub:
Visit GitHub Repository